Lab Software Development 2 - free-carrier DIFFUSION analysis system
Quick screenshot:
Paper using the software: https://www.nature.com/articles/s41467-021-25311-1
Motivation:
This is a much more challenging project than the free-carrier lifetime analysis system even though this one does not include hardware control or communication. The free carrier diffusion measurement was already established and is running well. However, it is always very troublesome to do the diffusion length extractions, as our tools require three major fittings - signal response curve fitting, laser profile fitting, and convoluted Gaussian diffusion fitting. It is not possible to find a convenient commercial tool in the market to do the analysis, and it was very time-consuming to do manual analysis with Origin, Python, and other tools. A GUI would be much more convenient to use and can without a double boost the working efficiency of the lab.
Environment:
Since there is no control system needed, there is no need to use the lab-oriented tool LabView. Instead, I chose QtCreator and Python as parts of the analysis system algorithms was achieved with Python already, which was already a lot of programming work.

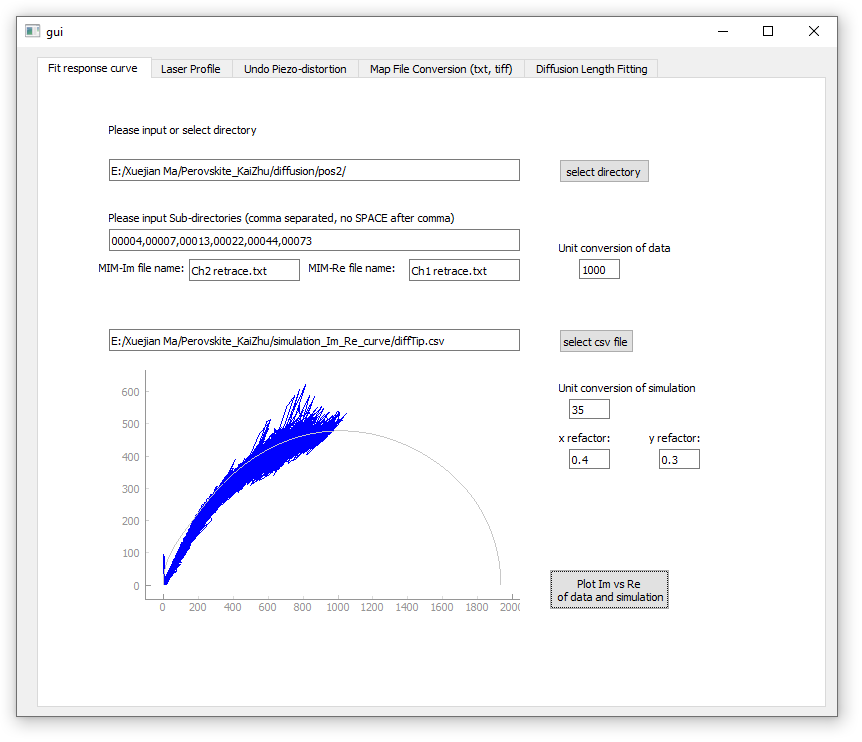
Functionality - Fit response curve
Our measurement tool (Microwave Impedance Microscopy, or MIM) is quite unique. It yields two channels of signals while both contain parts of the information of local conductivity. To really extract the needed data, we need to use a response curve for conversion. Fitting response curve involves a phase diagram as shown below. If the data points are spreading around the response phase curve, we claim that the fitting meets the requirement. Since users usually measure multiple diffusion maps under different laser intensities, we use the file structure with “Sub-directories” to make everyone’s life easy. Basic I/O schemes are implemented in loading and saving files.
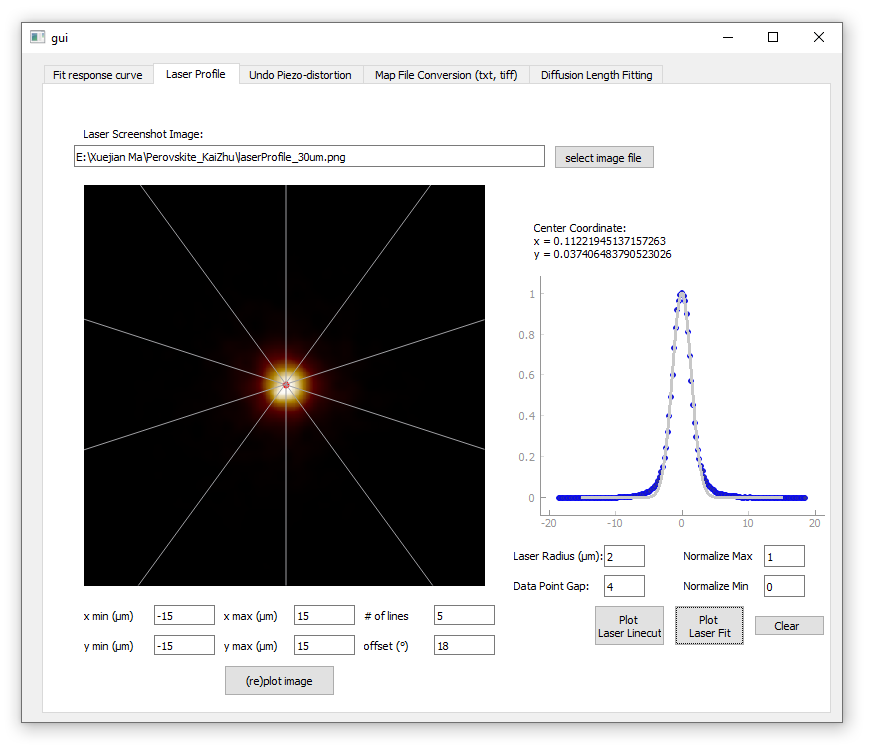
Functionality - Laser profile / Diffusion fitting
Fitting laser or diffusion profile with gaussian or convoluted gaussian functions and extracting laser width or diffusion length is extremely tricky practically in two ways. First, the profiles, especially diffusion profiles are usually not perfectly symmetric. Taking one line across the center may keep a lot of noise in the analysis. It would be ideal if users can take the average with multiple lines radially selected. The second tricky thing is that the center of the profile is not necessarily always exactly at the center. It would be ideal if users can freely select profile centers for different mappings. Solving the two tricky issues required interactive GUI programming skills and took me some time to figure everything out. Below is an example of the analysis. By clicking the center of the laser profile and choose 5 averaging lines, the software evenly chooses target lines and transfer the averaged data into the fitting window. By fine tuning the parameters of the fitting curve, we can easily, and repeatedly, do quick fitting as we want. Fine tuning the center point is now also possible to achieve a better and more solid analysis.
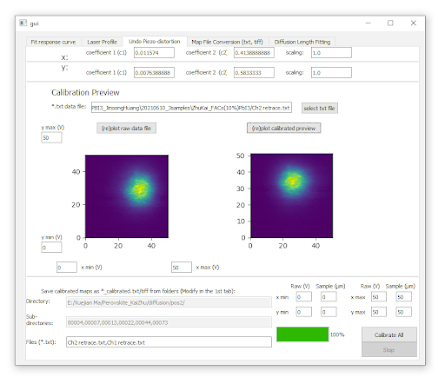
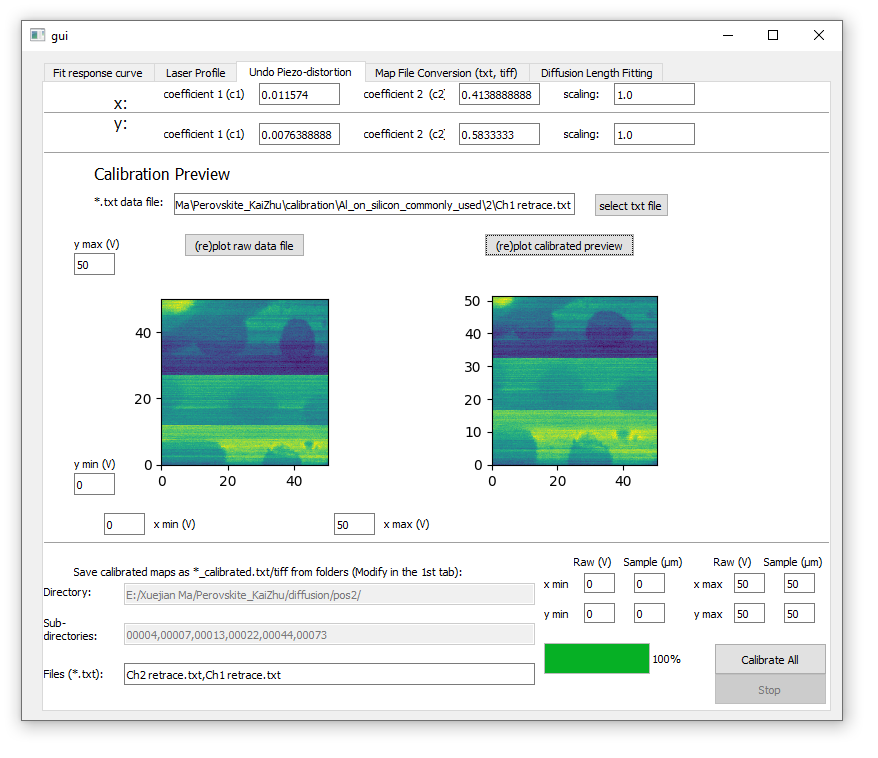
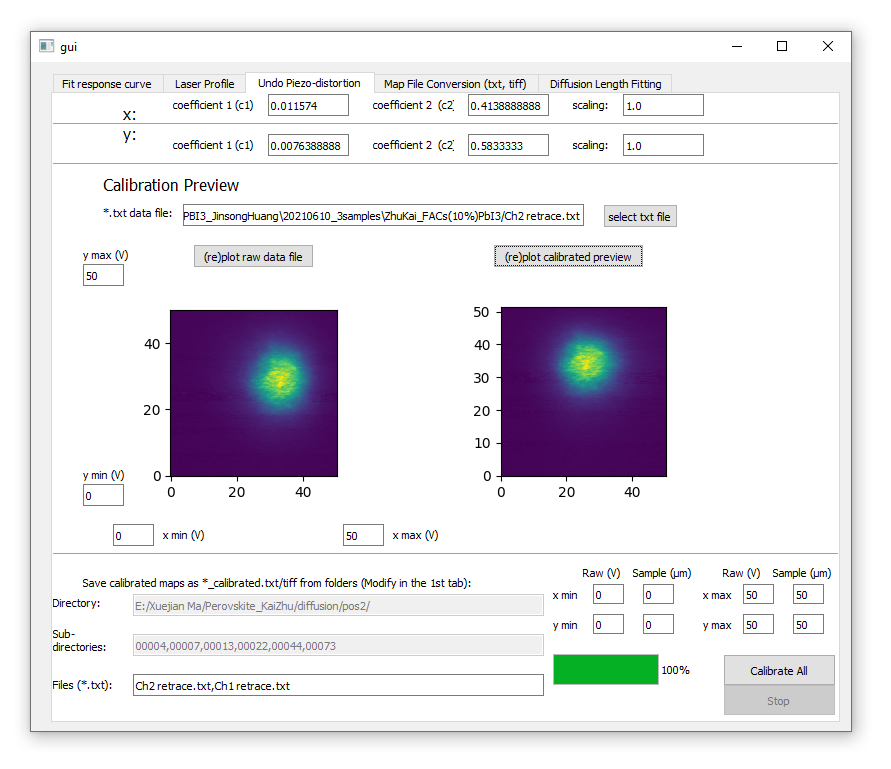
Functionality - Undo Piezo-distortion
This functionality is designed to solve one issue: distortion of the piezo stage which controls x and y scanning range. Basically, the piezo stage may not respond to the voltage in a perfectly linear way, which will cause distortion of the graph if we plot it with voltages as coordinates. In order to get rid of the piezo distortion, we need to do some calibration measurements with standard samples with known distances between structures. It’s obvious that the algorithm needed for removing distortion should be at least in the second order. With the fine tuned parameters while observing the distances of the dots as shown in the figure below, we can get the wanted parameters for the un-distortion process for the real data. Then we can convert the real data into the undistorted one as two figures below. After the user gets the coefficients, automatic conversion of all needed data can be done in the last sector of the tab. This conversion itself can intuitively take as long as O(n^4) time complexity. With indices as locators, I managed to reduce the time complexity to O(n^3). (see resample() method in utils.py)
Summary
Up until now, all basic functionalities needed for quick analysis are finished. There can be more add-ons for the software such as the "map file conversion" which converts between tiff and txt formats, and a separated "Diffusion Length Fitting" with more specific parameters to tune. Overall, this project, even without controlling hardware, is much time-consuming and requires more solid algorithm improvements. With the software done, the users including me myself definitely benefit a lot and can finally get away from the redundant data processing schemes with other primitive data analysis tools.
This project is open source. Feel free to use or improve it if needed.
Github link: https://github.com/xuejianma/LabTools/tree/master/DiffusionAnalysis
Comments
Post a Comment